Beware of large numbers. Is your market sizing being misled by published analysis?
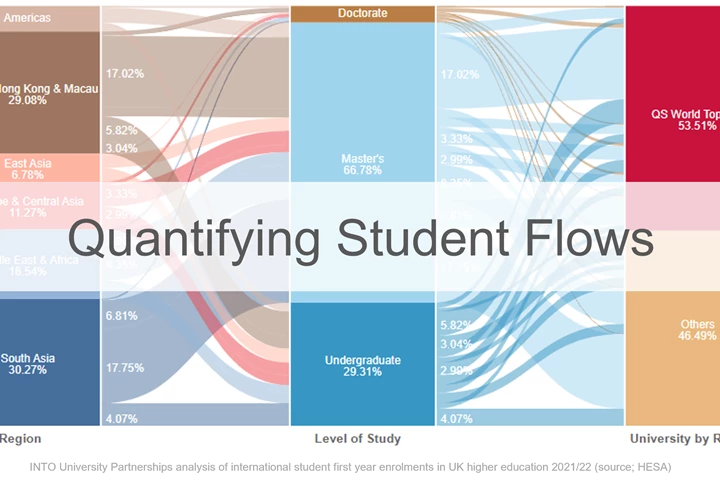
International student mobility patterns have been significantly disrupted in recent years. And they continue to shift, with many universities challenged to be less financially reliant on a particular source market (generally China or India), new transnational education arrangements, and concerns around ‘edu-immigration’ influencing policymakers and institutions, with implications for student choices. Higher education providers are left to consider where they will target recruitment growth in future. Where is the demand currently? Where is it likely to exist in future?
Diversity and internationalization within higher education are fascinating topics with many different lenses to explore these issues through. We will write further on this over the coming months.
For those trying to quantify existing or future student flows, for either commercial or academic purposes, here are some of our learnings at INTO University Partnerships from extensive work with international education data, to help you avoid some of the pitfalls.
1) Does the data accurately describe the market you are seeking to understand?
It’s not uncommon for market studies to present attention-grabbing assessments of scale. But what does it mean for your organizational goals?
For example, statistics about international students hosted in the USA often include those still registered with their host institution but since employed in post-study work via the Optional Practical Training (OPT) scheme. The distinction is not always explicit, but is important as in 2021/22 this accounted for almost 20% of the 948,500 international students within the USA (and it differs significantly by nationality too; India was as high as 34% contrasted with 11% for students from the Middle East). Including those in post-study work is not a common feature of higher education statistics collected in other destinations and inflates the perceived scale of those actively participating in their studies.
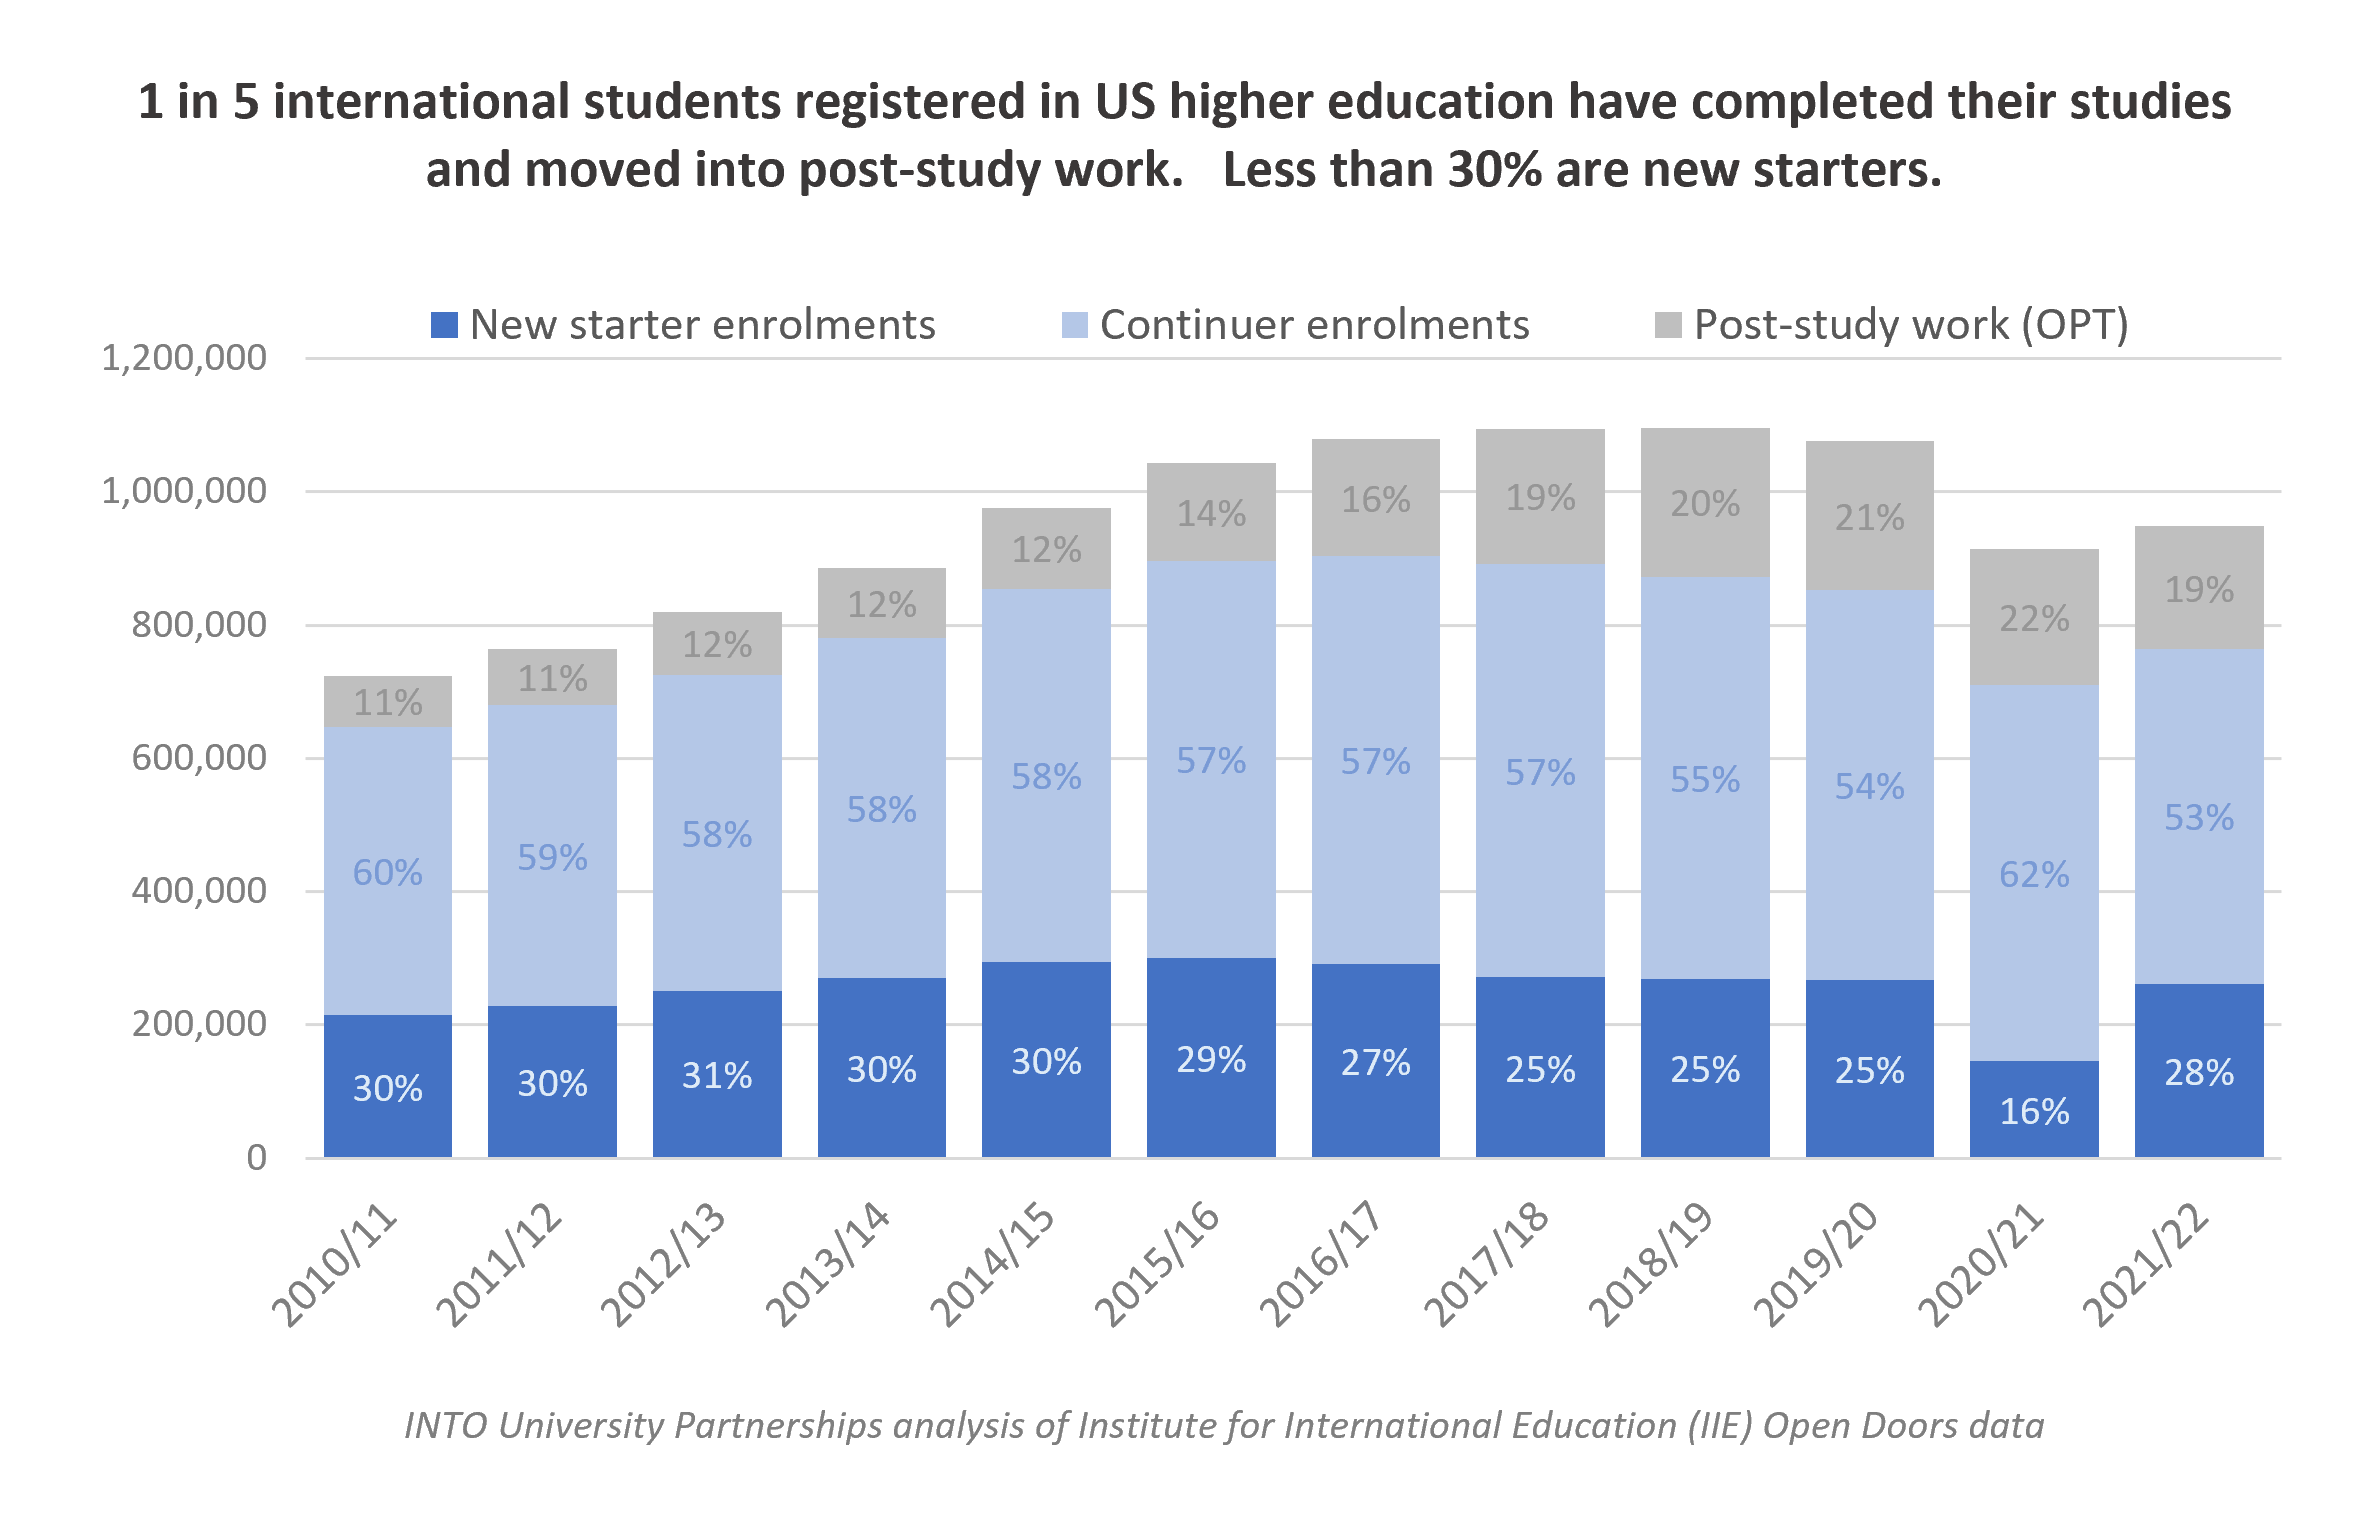
If your organization is providing services to all resident international students (such as financial or support services) the total population may be an appropriate measure. But if you’re assessing trends regarding those still studying, or new entrants it’s a nuance to be aware of. Interrogate the methodology of data you utilise and question its application.
2) Build an understanding of student flows in a more global context, requiring exploration of nuances in different education systems and data captured
Globally mobile students will weigh up the value propositions across a range of study destinations. Factors such as in-study or post-study work entitlements are key determinants of choice for many, and becoming an important way in which countries are competing. Growth or decline in one study destination cannot be understood in isolation from what’s happening in another.
Building a more global view can involve piecing together data from different jurisdictions (e.g. at INTO we regularly contrast what is happening across key study destinations). In doing so, it’s important to consider how course classifications match across national datasets. And if the periods described are consistent. Does the data relate to total or new enrolments at the level of granularity you can access? Sometimes you’ll need to make assumptions to align datasets (e.g. estimating new starts, which aren’t always published at a detailed level, such as in the US and Canada).
Take note of different delivery models too. Master’s degrees in the UK can generally be completed within a year, contrasted with that of the USA where it’s more common for these degrees to take two years. It would be very easy to arrive at completely different views of market share, based on the metric used, as showcased below. A seemingly underreported aspect of changes in demand over recent years, is that the number of international students starting [post-]graduate studies in the UK, was 76% higher in 2021/22 than in the US.
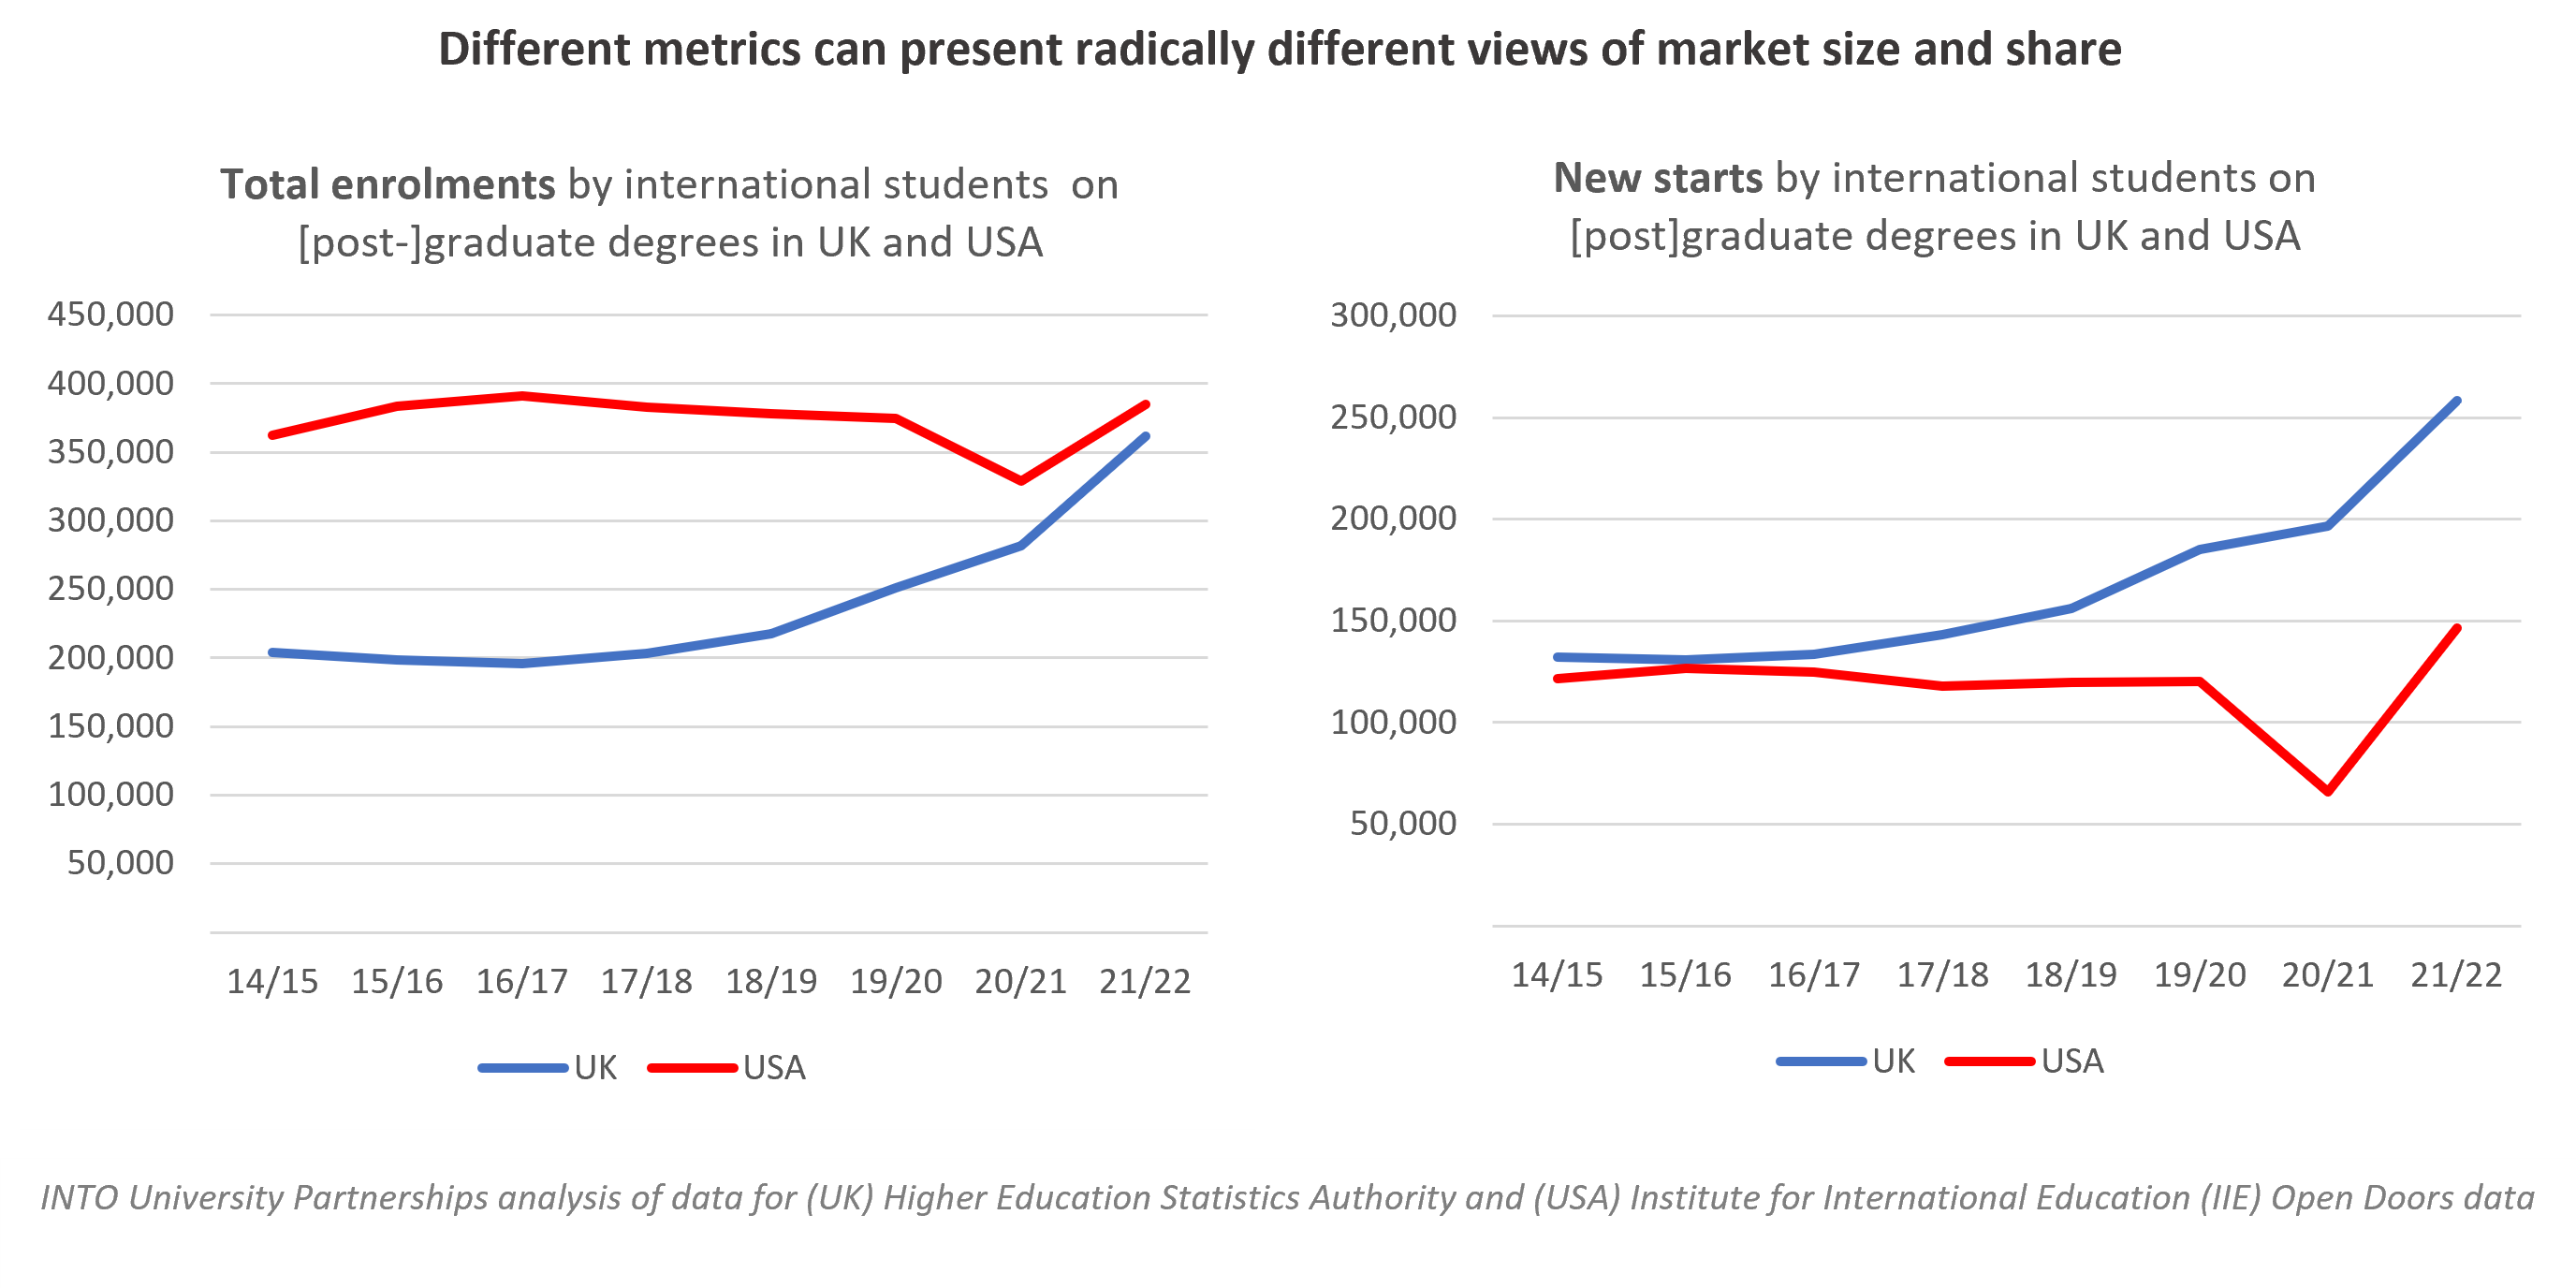
The comparison isn’t perfect. US data collections are completed with institutions reporting student numbers during their Fall/Autumn census. Whereas, UK higher education enrolment data provides a full-year position. Nonetheless, the comparison is indicative, and recognizing these nuances will improve any modeling you undertake.
3) Don’t assume that the provision mix is the same in different destinations
Recently I saw an article detailing how 22,000 Brazilians and Colombians were enrolled on courses in Australia at the end of 2022, flagging a potentially missed opportunity for North American universities. Importantly though, 90% of these students are studying ELICOS (intensive English) provision within Australia, with just 2% on university courses (the same scale and mix undertaken pre-pandemic). By contrast at the end of 2022, about 50% of Brazilians and Colombians registered in the US were studying on a degree program. Explore the details available in each dataset and consider whether specific segments of the market are your focus and addressable.
4) Consider the usefulness and accuracy of proxy measures
Sometimes you simply won’t find the exact data you want. Study visa issuances have historically been a useful proxy for new incoming student demand, and this is generally available at the nationality level which is particularly useful if enrolment data does not exist.
But does the issuance of a study visa equate to enrolment? And is it necessarily higher education related? This varies by country, based on differing practices. For example, the huge growth of Canada as a study destination has been well-reported and the latest statistics showcased that 807,000 foreign nationals held valid study visas in 2022, often reported in education press as enrolments.
However, the detailed data shows that 650,000 of these visas are related to post-secondary provisions. In recent years there has also been increased focus in Canada on the rise in study visas that have not translated into actual enrolments. This is evident when contrasting active visa numbers with reported enrolments across the Canadian post-secondary system.
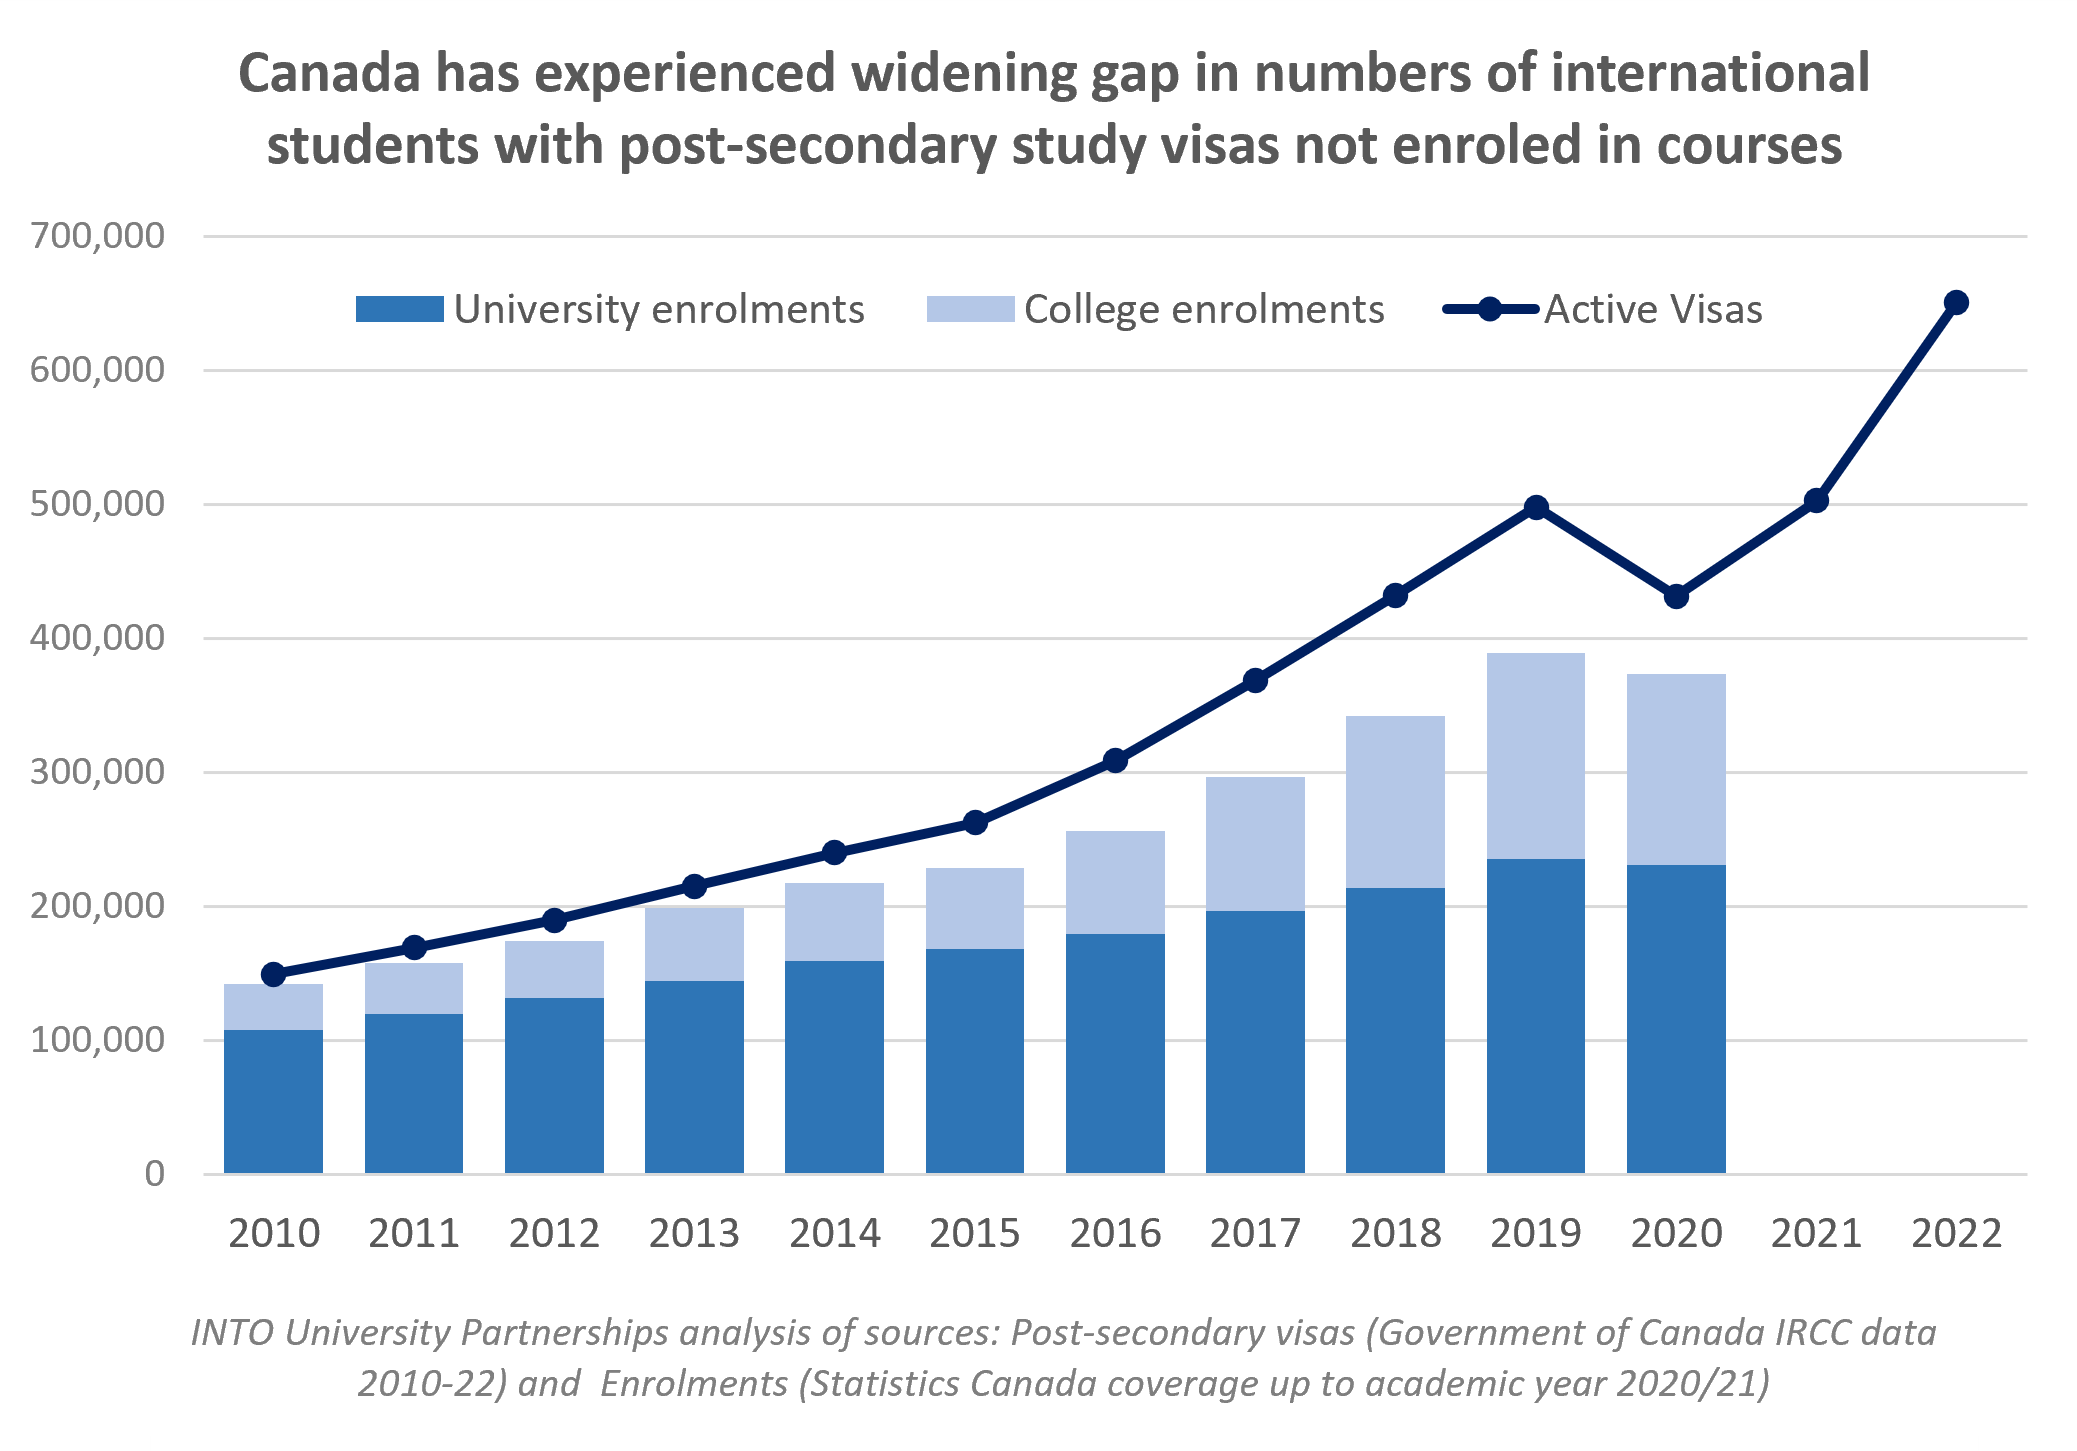
This example also showcases how a significant proportion of international students entering Canadian tertiary provision have done so on college courses, as distinct from the university sector. The same is the case in Australia and can vary significantly by source market. As with the previous example about provision mix, this can inform segmented views of demand and should also be factored into any interpretations of international student surveys, that are often published.
What is important in this context, is seeking to understand and cross-reference different sources of data to arrive at a clearer picture for your given purpose. And be careful when making comparisons between data collected by different national agencies.
One other example of where visa data can be misleading is when policy changes how we understand what the data is explaining. Following Brexit, EU students now require study visas to enter UK higher education. Therefore, comparisons before and after the transition require this nuance to be understood. The growth in visas presented is a misleading portrayal of growth in enrolments. EU student numbers in the UK have actually reduced significantly.
5) Could available data actually understate market size? Interrogate what is not included.
One aspect of market sizing that can be tricky, is not simply understanding what is included in available data, but what is potentially excluded.
As an example, Foundation courses remain a very significant entry route for many international students into undergraduate degrees in countries like the UK and Australia, where thousands of students require support with English language, or supplementary academic study ahead of entry to the desired university course. But most Foundation courses do not get counted in core UK higher education statistics, due to the qualification framework methodology utilized. The impact of this provision is therefore often understated in the analysis of higher education pathways. Seek to understand detailed descriptions of data and reflect on their coverage.
6) Does the past provide a good barometer for the future?
Complexities of future state modeling require an entire article of its own. But by ensuring your baseline (current-state) analysis is as accurate and relevant as possible, then your approach to this core building block for constructing a future view will help minimize the potential for ‘garbage in, garbage out’!
The recent past can be a useful yardstick too. But other times it’s really not. Be aware of factors likely to disrupt student flows into a given country. Very often this will be related to visa access and rights. UK higher education has been shown to have experienced a massive increase in the number of students studying taught Master’s programs in the last few years. Significant to this was the expansion of post-study work rights via the UK ‘graduate route’. But this has also seemingly resulted in a large increase in the numbers of ‘main applicants’ (mostly from West Africa and South Asia) bringing family members with them under the current visa regime as ‘dependents’. This has created tension for the governments that are promoting a hard line on immigration.
A new approach by the UK government to prevent students from bringing family members during studies (unless on a postgraduate research degree) is expected to have a notable and negative impact on many source markets that have contributed to this recent growth. A policy like this has the potential to negatively impact the attractiveness of the UK moving forward and should be considered alongside other notable drivers of growth potential (e.g. changes in high school graduate numbers, domestic university capacity, or purchasing power via currency changes). Factor in your own assessments about likely future state, to inform scenarios. And remember that a possible contraction in demand in one location could also create growth opportunities elsewhere.
Conclusion
Quantifying the scale and profile of international student mobility is ultimately dependent on compiling, critiquing and comparing available data, collected in differing ways by multiple organizations or agencies, each with its own nuance. Some sources that present a collated global view often don’t address the issues raised in this article.
Hopefully, some of these pointers will be informative and can facilitate further conversation about what constitutes good practice in this field.